Bitcoin remains in a tight range with low liquidity, but expectations for new local lows are increasing.

Содержание статьи:


Bitcoin (BTC) looked poised to give up $27,000 as support on May 17, with traders waiting for new lows.

BTC/USD 1-hour candle chart on Bitstamp. Source: TradingView
Whales meet low liquidity
Data from Cointelegraph Markets Pro and TradingView showed BTC/USD trading near $26,800 at the time of writing.
The pair had staged multiple crosses of the $27,000 mark the day before, with that level forming a low-timeframe focus now at risk of breaking down.
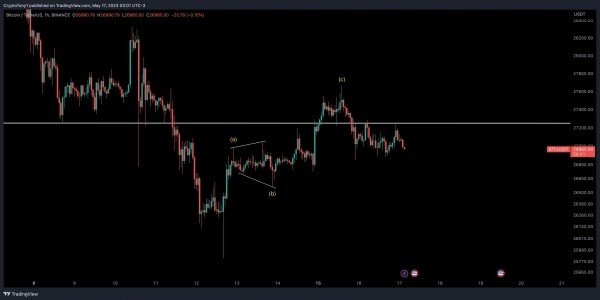
BTC/USD annotated chart. Source: Crypto Tony/ Twitter
“3 wave up into resistance, followed by a retest and a rejection off resistance zone,” popular trader Crypto Tony summarized about recent activity.
He added that a potential target to wait for was now $26,400.
Trading account TraderSZ had previously predicted an “expansion candle” to enter should the breakdown continue.
“Small long flush early in the morning,” another popular trader, Daan Crypto Trades, continued.
“On the Bybit futures chart we can see how asks were filled and from there on out spot pushed price down to take out the longs that accumulated in this mini range. Overall still choppy and no clear direction.”
Analyzing order book setup on Binance, monitoring resource Material Indicators noted an overall lack of liquidity.
The largest-volume traders, it revealed, had reduced activity to a minimum as a result, perhaps due to that absence of coins exposing them to potential slippage.
Zooming out, however, an accompanying narrative for many remained the concept of “choppy” price action continuing.
The current trading range, featuring as a key support and resistance zone from 2021 onward, showed no signs of relinquishing control.
“For the next few days I expect price action to be choppy between $27.2k – $26.5k,” Titan of Crypto wrote in one such market appraisal.

BTC/USD annotated chart. Source: Titan of Crypto/ Twitter
$25,000 BTC price target in stocks comparison
While bullish in the long term, trading group Stockmoney Lizards offered a potential downside target of $25,000 on the day.
Related: Bitcoin trader eyes CME gap with $24K BTC price dip target in play
Acknowledging the “head and shoulders” formation playing out during April — a bearish signal reported previously — it also presented the 25-week simple moving average (SMA) as a possible support line.
The 25-week SMA stood at just $23,100 on the day but was set to rise toward the potential retest in June.

BTC/USD annotated chart. Source: Stockmoney Lizards/ Twitter
A separate post nonetheless called the overall shape of price performance a “well-known” pattern, referencing similar moves on United States equities in years gone by. These moves ultimately resulted in a break to the upside.
Magazine: Alameda’s $38B IRS bill, Do Kwon kicked in the assets, Milady frenzy: Asia Express
This article does not contain investment advice or recommendations. Every investment and trading move involves risk, and readers should conduct their own research when making a decision.
Source: cointelegraph.com